


Recently, I participated in a data cleaning challenge organized on Twitter, where I had the opportunity to use Power Query for the first time. I found the experience to be both fun and challenging, and it exposed me to the capabilities of this powerful data transformation tool, from which I certainly learned a whole lot. In this documentation, I will share my experience using Power Query for data cleaning, as well as some tips and best practices that I learned along the way.
Power Query is like a big brother to Excel. It has a user-friendly interface and the ability to handle much larger datasets. It can connect to a large number of data sources, while Excel's connectivity capacity is limited. Power Query also allows users to easily repeat the cleaning process on new data, making it a time-saving tool for data analysts and business users. It has applied steps that are very useful for tracking the number of transformations with data. It allows you to return to previous steps and also delete steps.
Before I started the cleaning process, I took some time to study and understand the data set. When cleaning data on Power Query, there are various things to look out for, such as:
Incorrect data type- The column should have the correct data type to avoid calculation errors and ensure it is compatible with other tools or databases.
Inconsistent data format- Inconsistencies in data formats, such as inconsistent date formats or mixed-case text are made consistent using Power Query's transformation functions.
Outliers- Outliers in the data could alter the analysis results. They are either removed or transformed using appropriate methods.
Duplicates- Duplicate records are identified and removed to avoid overcounting or bias in the data.
Missing or incomplete data- Missing or incomplete data are either removed from those records or filled in using appropriate techniques.
About the data
The dataset used is the FIFA 21 dataset gotten from Kaggle. It contains the details of football players alongside their performances, updated up until 2021. The dataset was downloaded as a CSV file and opened in Power BI’s Power Query. The dataset contained 18979 rows and 77 columns.
Loading the data into Power Query was pretty easy:
Open Power BI Desktop
Click on "Get Data" on the Home tab and select the data source from the list of available options. In my case, the data source was a text/CSV file. This action launches a local file browser where you can select your text file.
Select the data you intend to clean and click open. This opens a navigator pane where you can either load into Power BI or transform using Power Query. Click transform.
This opens the Power Query Editor. Now we're ready to clean and transform our data.
DATA CLEANING
Data cleaning was performed on the dataset to correct various issues. The following columns were cleaned, and the methods used are described below:
Whitespaces- On loading the data into Power Query, the cells had whitespaces. I simply removed them by unchecking "show whitespace" found in the view tab on the ribbon.
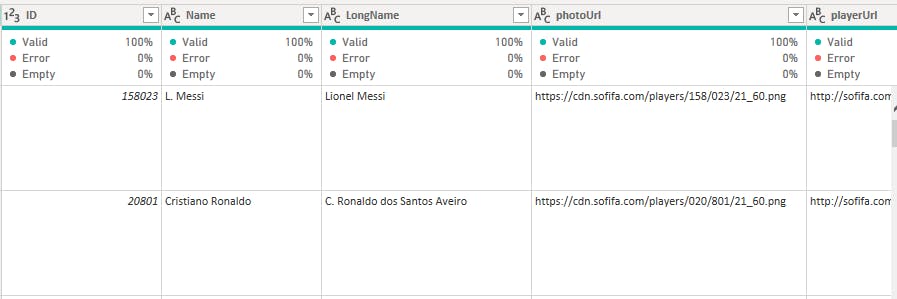
Name and LongName: Special characters were present in the Name column, which was resolved by filtering to identify names with special characters and replacing them with the clean version. This enabled proper alphabetical arrangement of the names and eliminated entries after the letter "Z". No issues were observed in the LongName column.
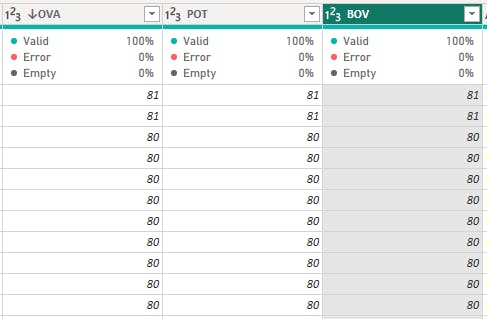
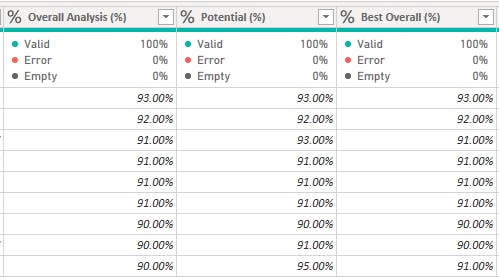
OVA, POT and BOV: These columns were in whole number data type instead of percentage. To convert them to percentages, the values were divided by 100, and the data type was changed accordingly.
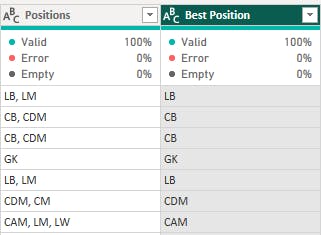
Positions: The Best_Position column contained redundant information also present in the Position column, so it was dropped.
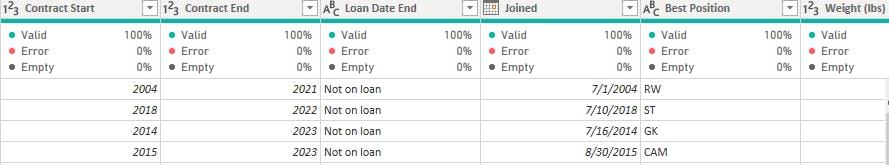
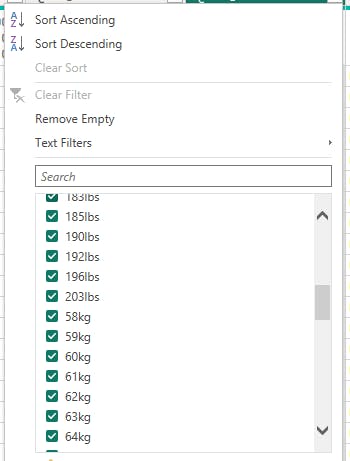
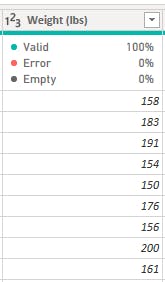
Weight- The "Weight" column contained values for player weights in both kilograms and pounds. To standardize the values, I converted all weights to pounds. Firstly, I created a conditional column that assigned a value of 1 to any weight ending in "lbs" and a value of 2.205 to any weight ending in "kg." Next, I used the "Split Column" function to separate the digits and non-digits in the "Weight" column. This allowed me to change the data type from text to whole number, which enabled me to perform calculations. Finally, I multiplied this column by the conditional column I created earlier to obtain all the weight values in pounds.
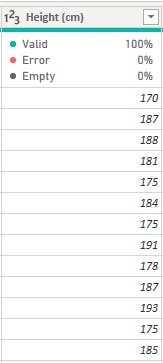
Height- Height- The "Height" column contained values represented in both "cm" and "feet". To standardize the values, I first separated the values represented in cm from those in feet.
For the values in feet, I converted them to cm by first converting the feet to inches. Since one foot equals 12 inches, I multiplied the values in feet by 12 and then added any additional inches to get the total value in inches.
Next, I multiplied the resulting values in inches by 2.54 to get the corresponding values in cm. This allowed me to standardize all the values in the "Height" column to a single unit of measurement, which made it easier to work with and analyze the data.

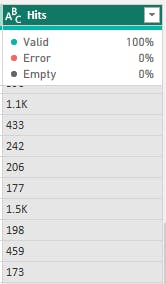
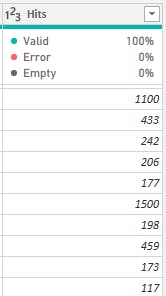
Hits- The "Hits" column contained values with a "K" suffix, such as "1.5K" instead of "1500". This caused the column to be stored as a text data type. To handle this, I created a conditional column that assigned a value of 1000 to any value in the "Hits" column ending with "K", and a value of 1 to all other values.
Next, I removed all non-digit characters in the "Hits" column to convert the data type to a whole number, which allowed me to perform calculations. Finally, I multiplied this column by the conditional column I created earlier to standardize the values that previously contained suffixes. This enabled me to work with the "Hits" column more consistently and meaningfully.
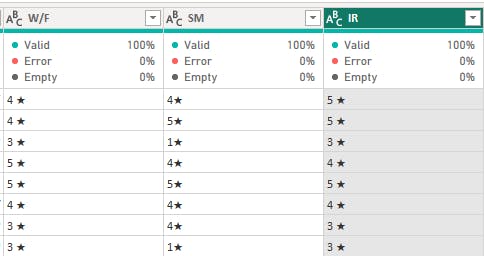
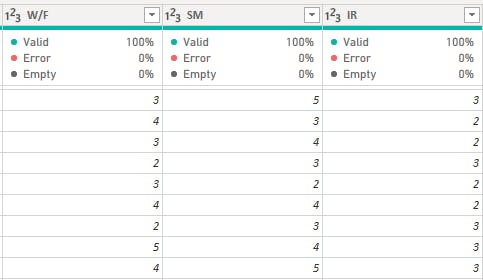
W/F, S/M, IR: These columns contained player ratings ranked 1–5, represented as text with a star symbol. The star symbol was removed using the replace function, and the data type was changed to a whole number after standardizing the values.
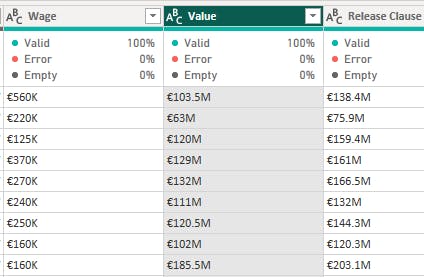
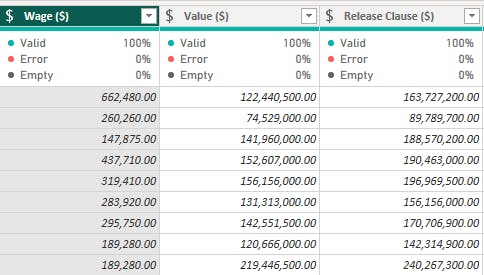
Wage, Value, and Release Clause- These columns contained values in euros, some of which had suffixes such as "M" and "K". To standardize these values, I used a similar process as the one used for the "Hits" and "Weight" columns.
First, I created a conditional column that assigned a value of 1000000 to any value in these columns ending with "M", a value of 1000 to any value ending with "K", and a value of 1 for all other values. Next, I created another conditional column that assigned a value of 1.183 (the euro to dollar exchange rate as of 2021) to any value ending with "M," "K," or without a suffix.
I split each of the columns using the "Split Column" function to separate the digits and non-digits and then converted the data type from text to a whole number to allow for calculations. Finally, I multiplied the resulting standardized column with the two conditional columns to obtain the dollar equivalent for all the values.
It's important to note that I carried out this process separately for each of the three columns, and not together.
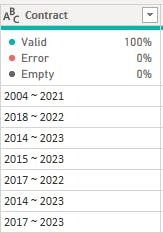
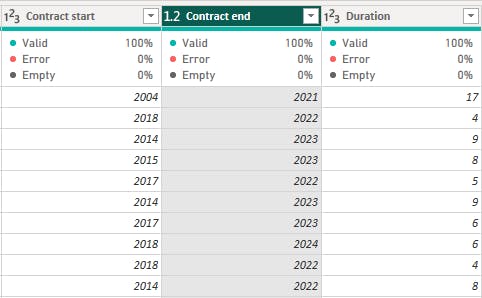
Contract: The Contract column contained conflicting data types and formats. The players whose contracts specified they were on loan tallied with the year on the Loan End Date column, while those whose contracts indicated "free" tallied with players who had no club. Records with conflicting information were dropped. The Contract column was split by delimiter using "~", resulting in two columns named Contract Start and Contract End. Entries showing "error" and "null" were replaced with "0" to enable conversion of the data type to date. A duration column was created by subtracting the Contract start from the Contract end.
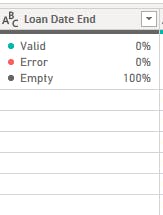
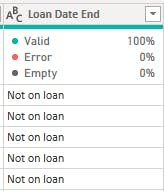
Loan End Date: This column contained mostly empty columns, indicating players that were not on loan. The empty columns were replaced with "not on loan".
CONCLUSION
Having done the data cleaning and validation, the data is now ready to be used for analysis and visualization. When you have clean data, you can make decisions with the highest-quality information and eventually increase productivity.